Create beautiful charts with Vue and Nuxt
Modern Vue charts and components to build beautiful dashboards. Built with Tailwind CSS and Nuxt UI.
Line Charts
Visualize trends and changes over time with elegant, interactive line charts—perfect for analytics and reporting.
Explore Line ChartsBar Charts
Compare categories and visualize distributions with interactive bar charts—ideal for summaries and breakdowns.
Explore Bar ChartsArea Charts
Show totals and highlight magnitude with smooth area charts. Great for visualizing stacked data and trends.
Explore Area ChartsDonut Charts
Display proportions and breakdowns with visually engaging donut charts. Ideal for showing parts of a whole.
Explore Donut ChartsTo be part of an amazing ecosystem
Customize every detail
Beautiful Data Components


See What the Others Are Saying
Grab a template, launch today
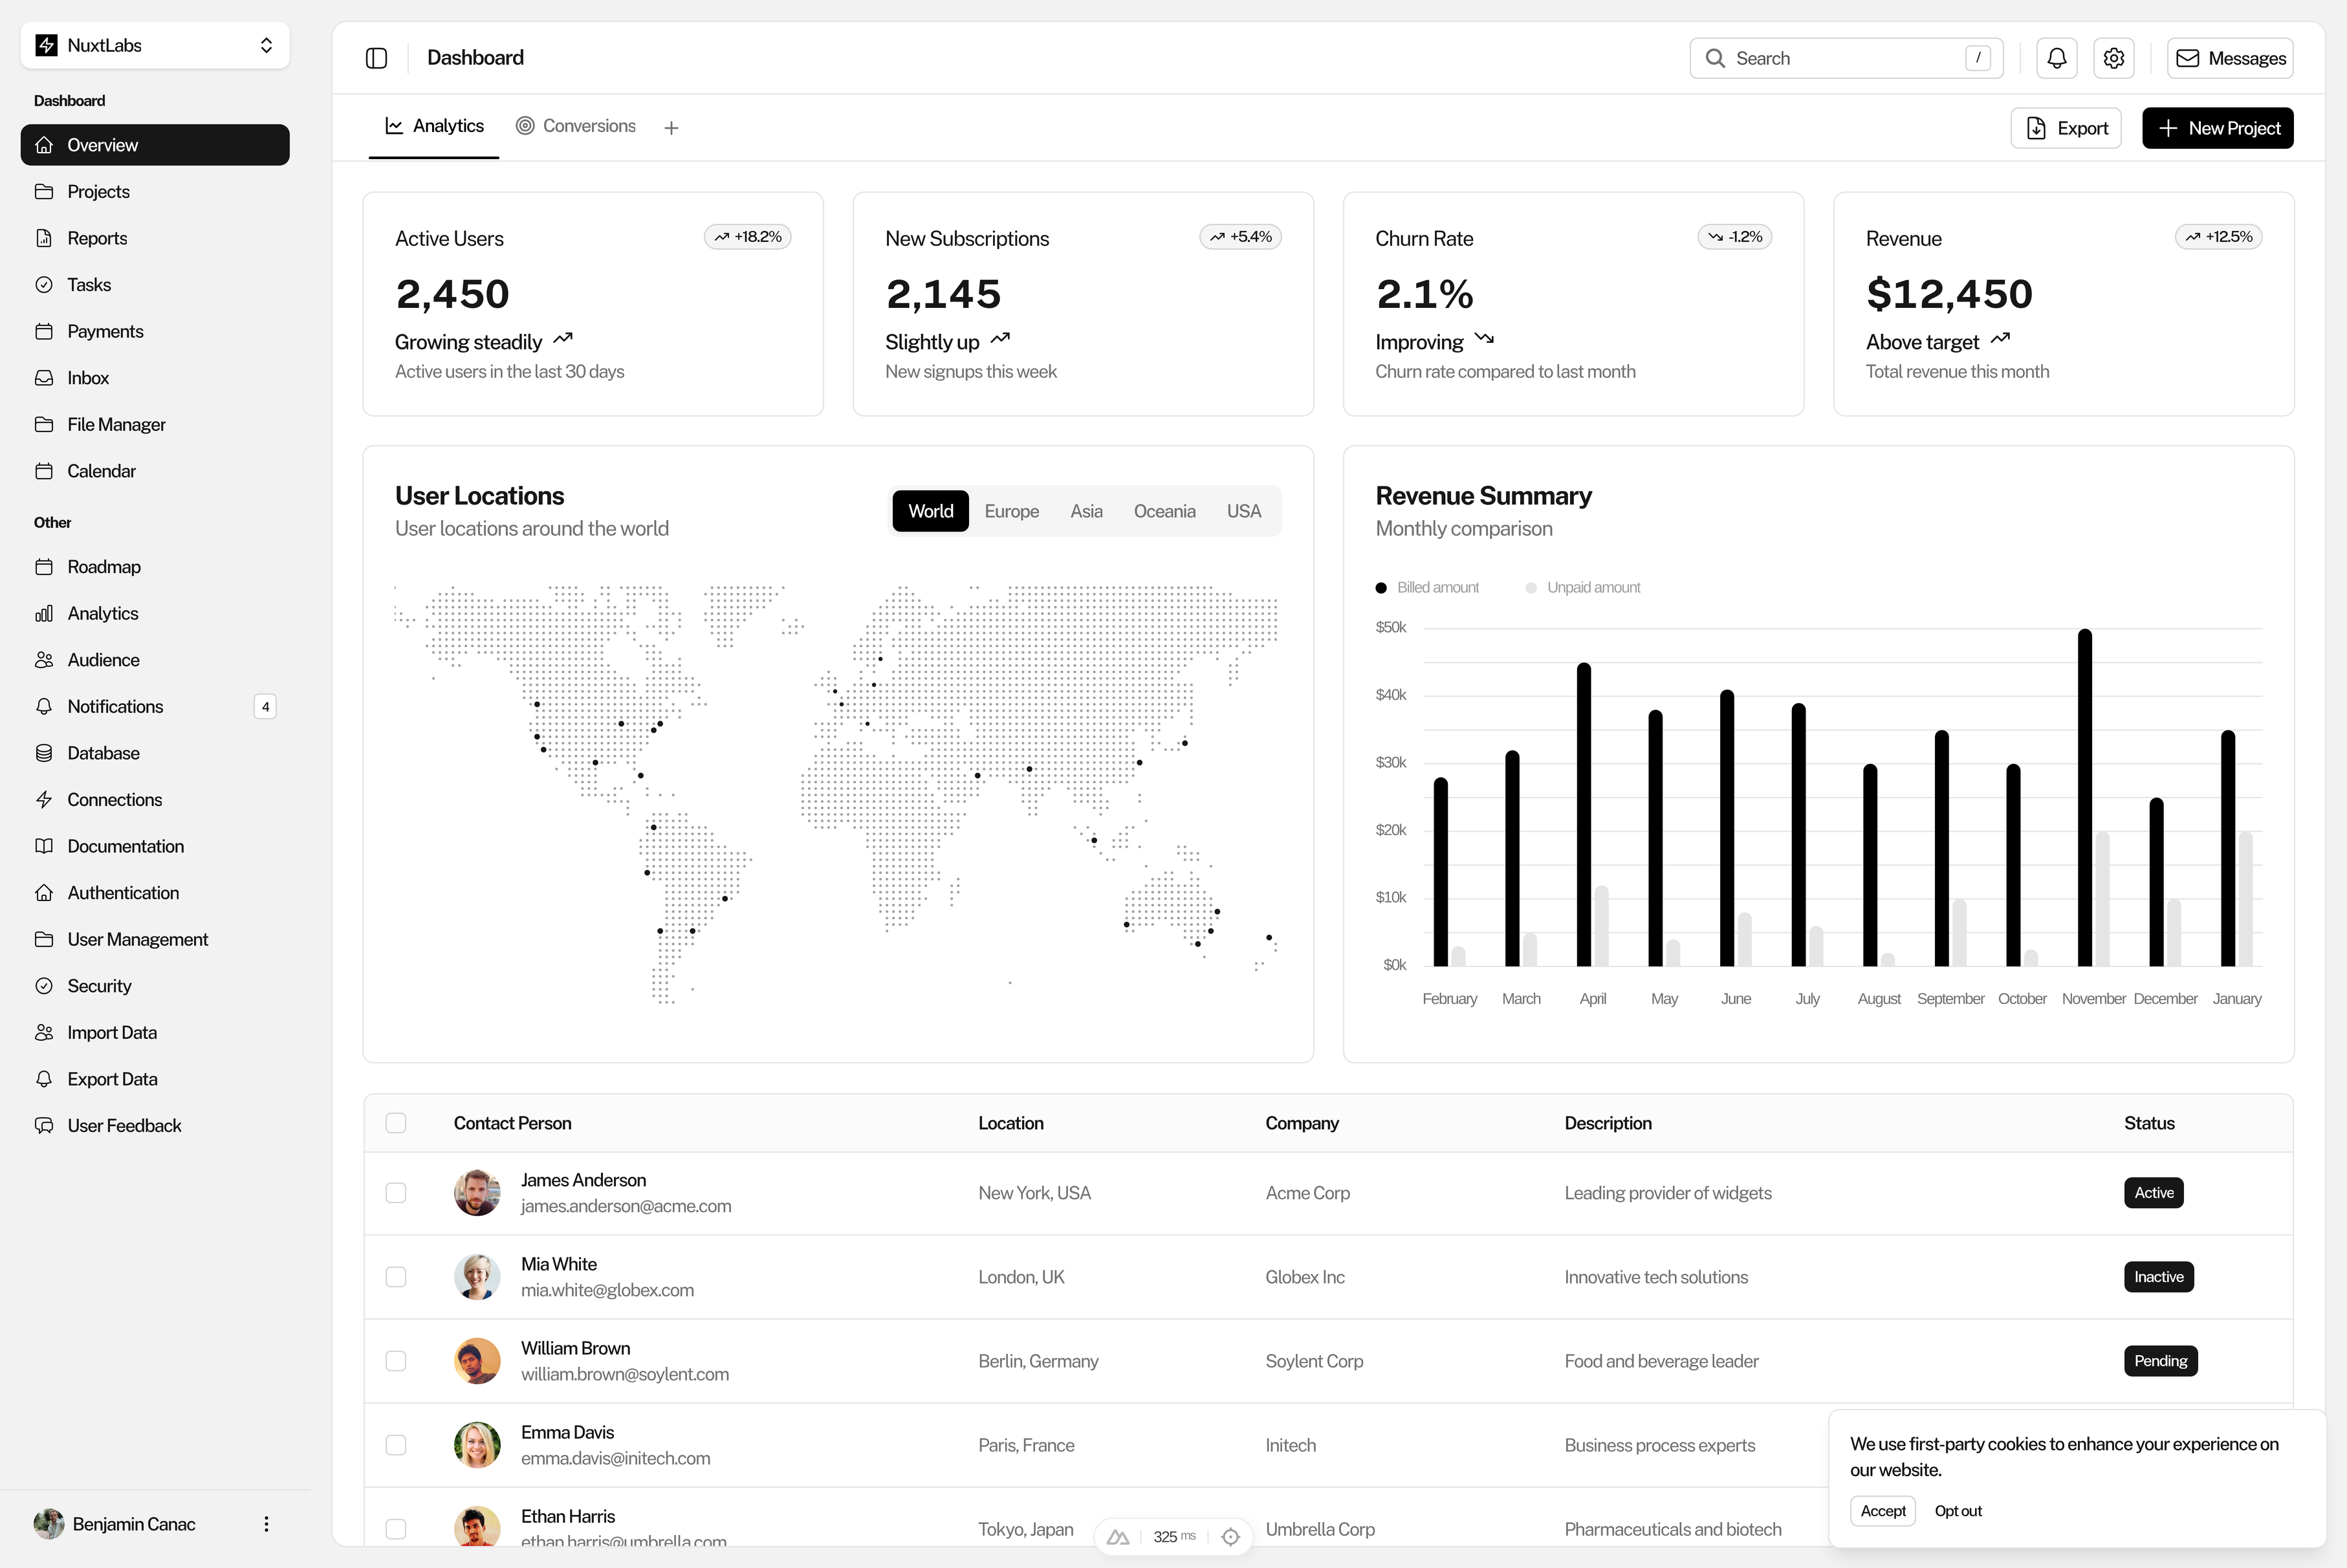
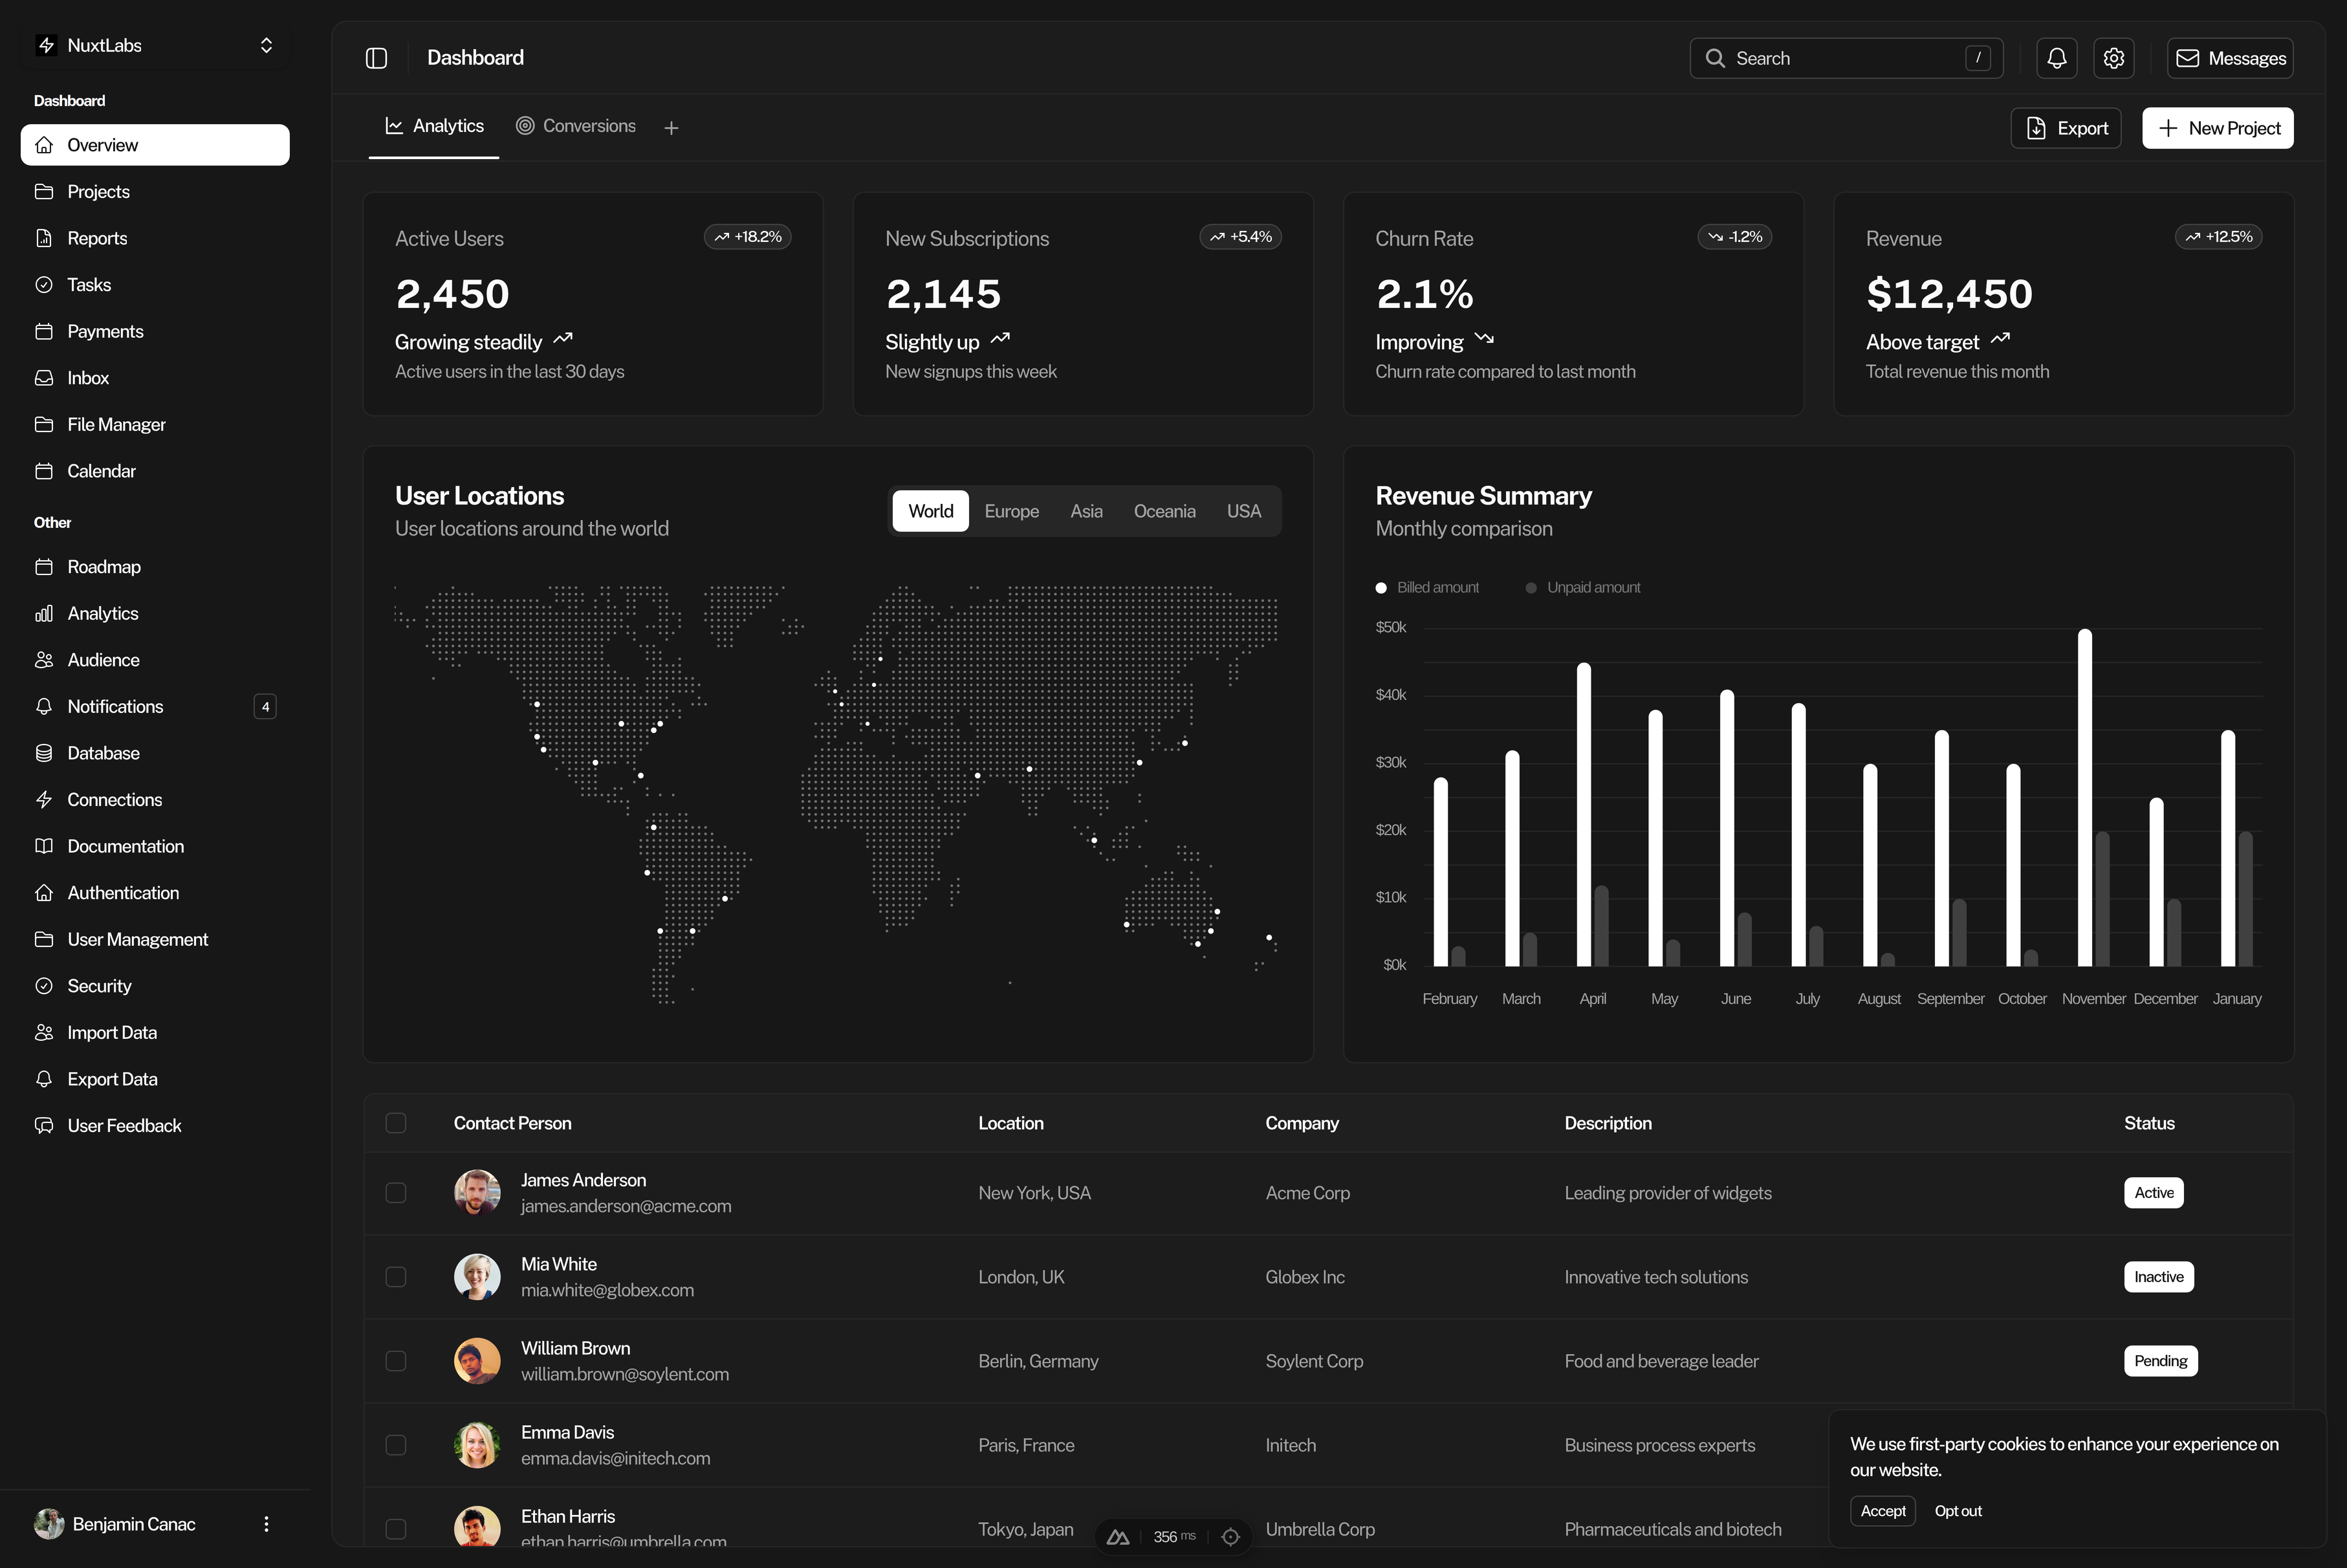
Clean Gray
A minimal, neutral-scale dashboard for data-heavy applications.
Shadcn Dashboard
A dashboard template styled with shadcn/vue principles.
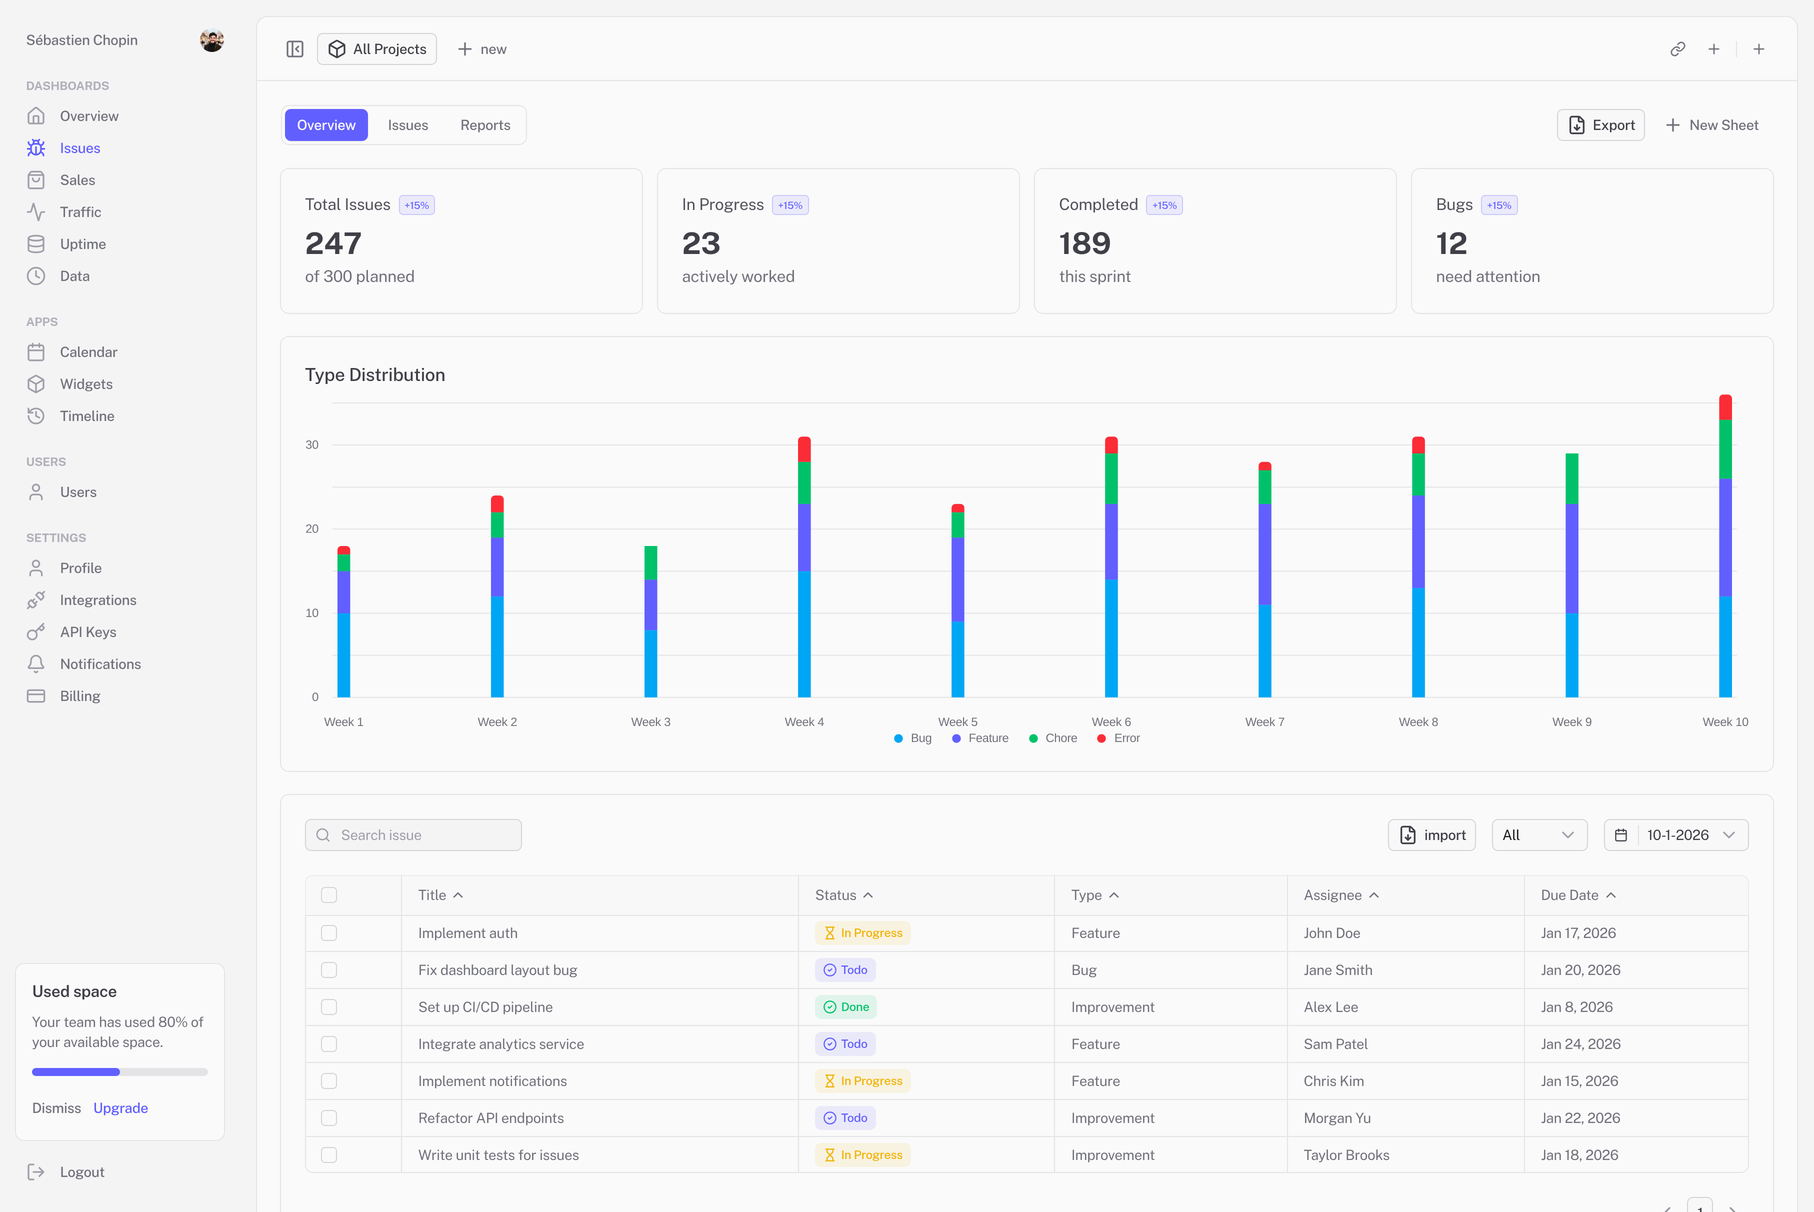
Planner
A Linear-inspired project management and planner template.
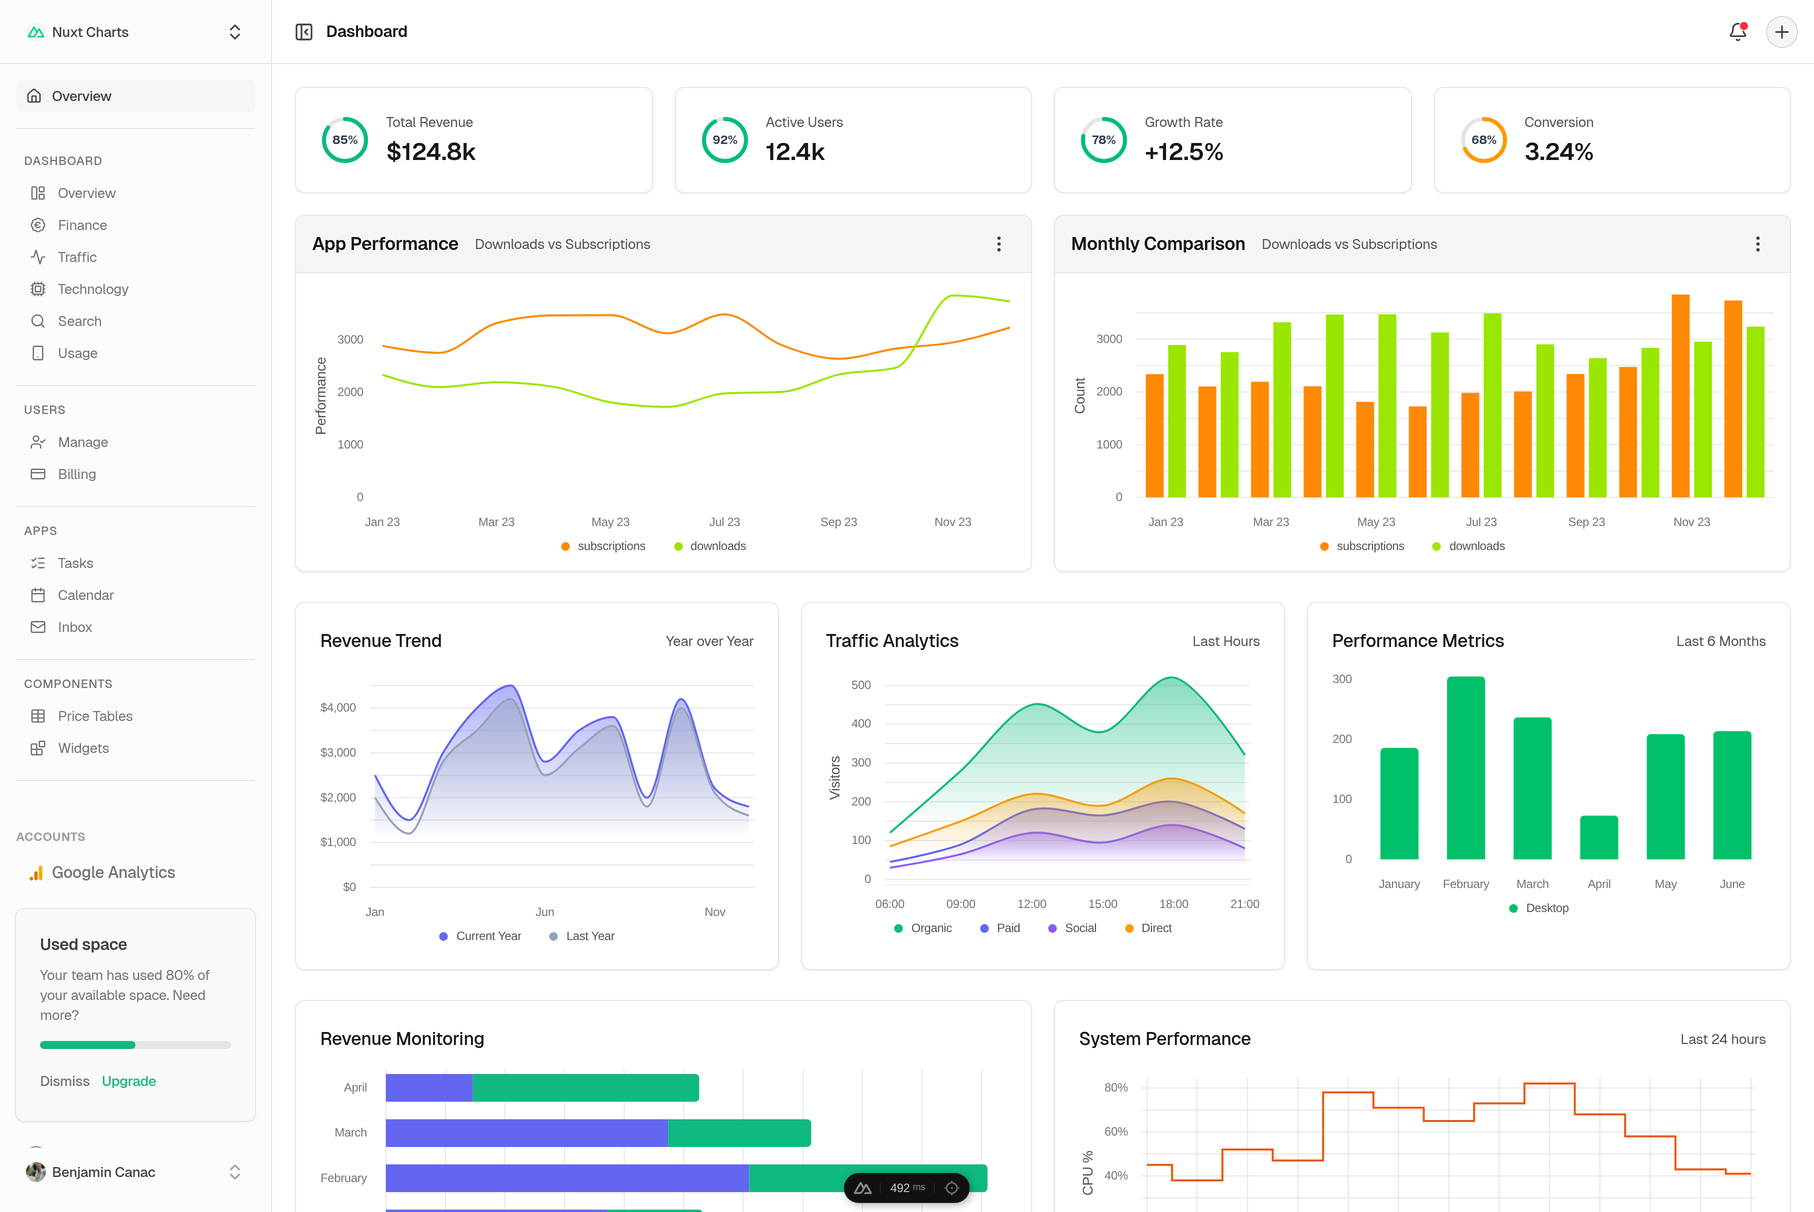

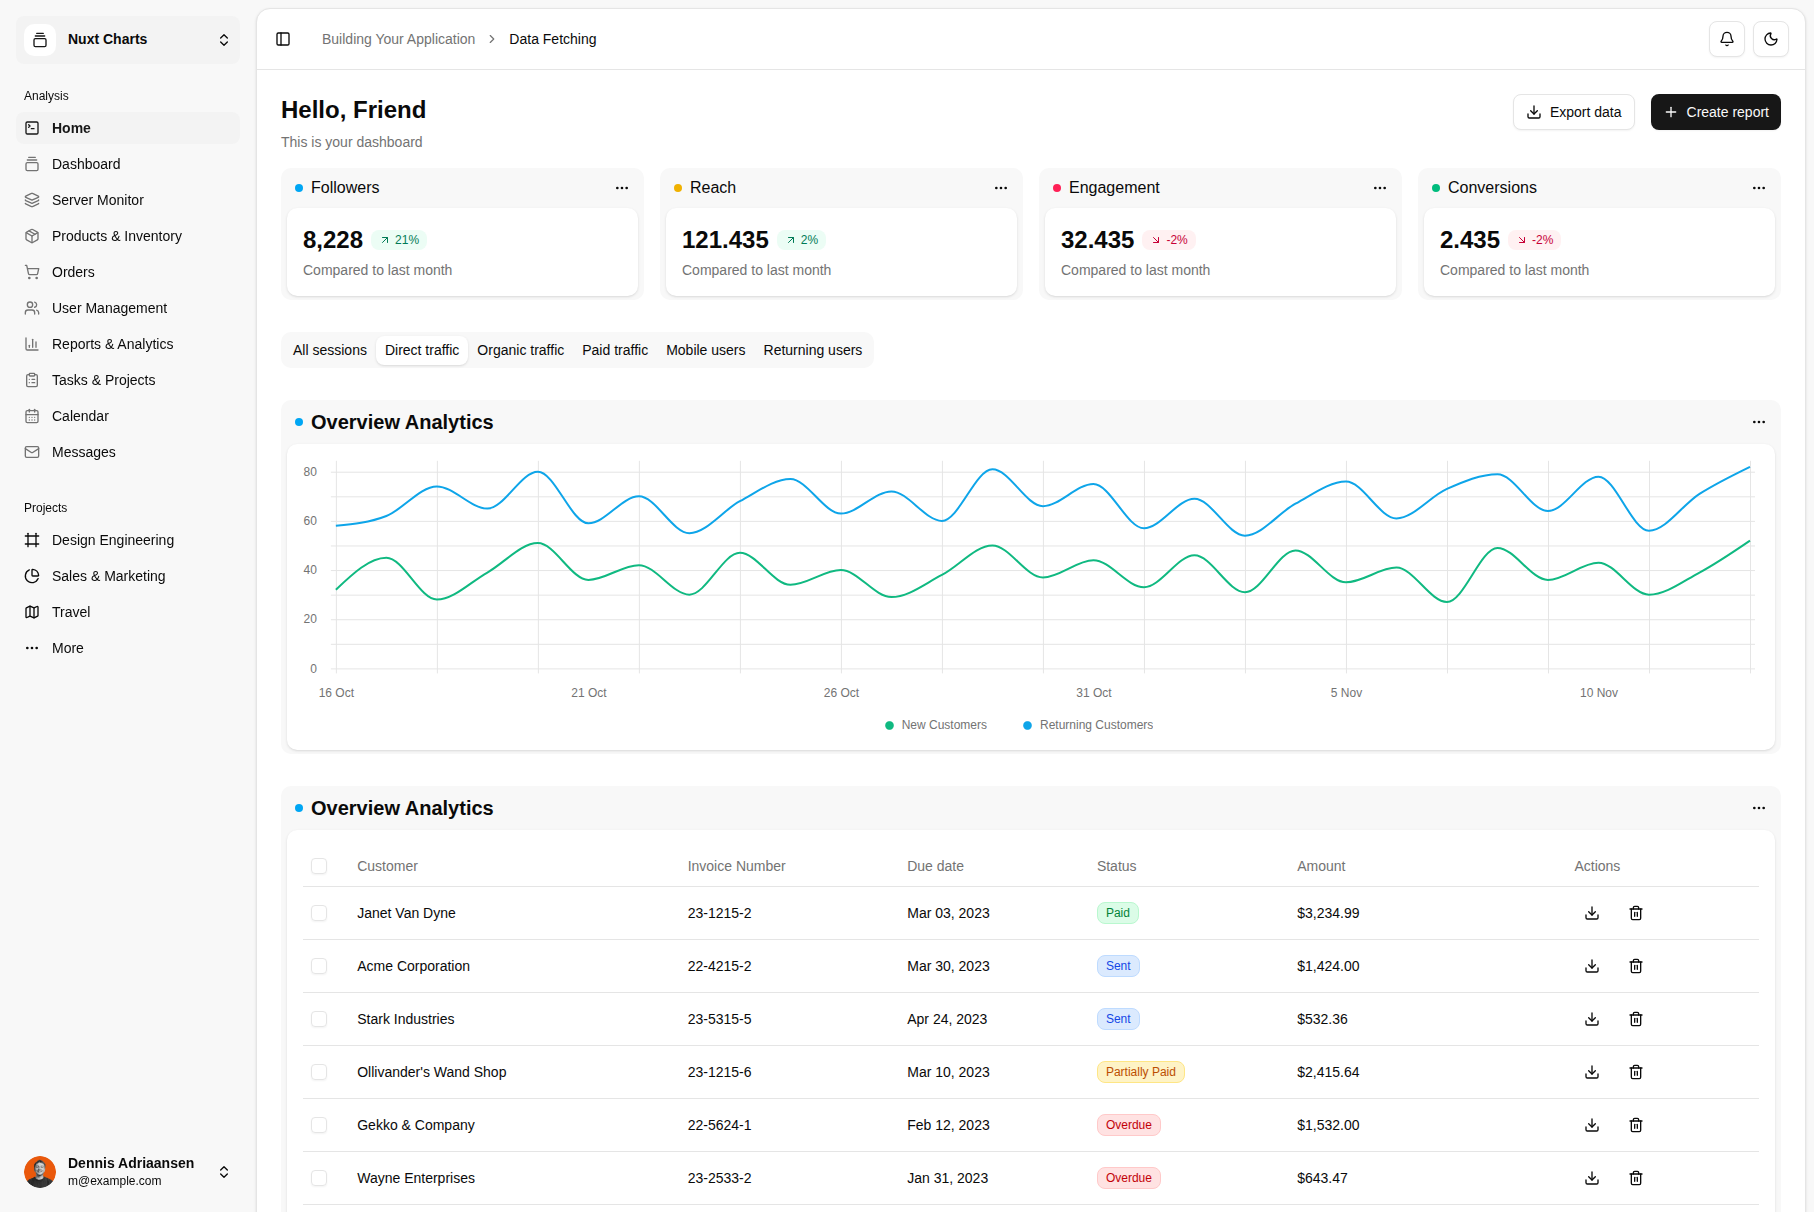
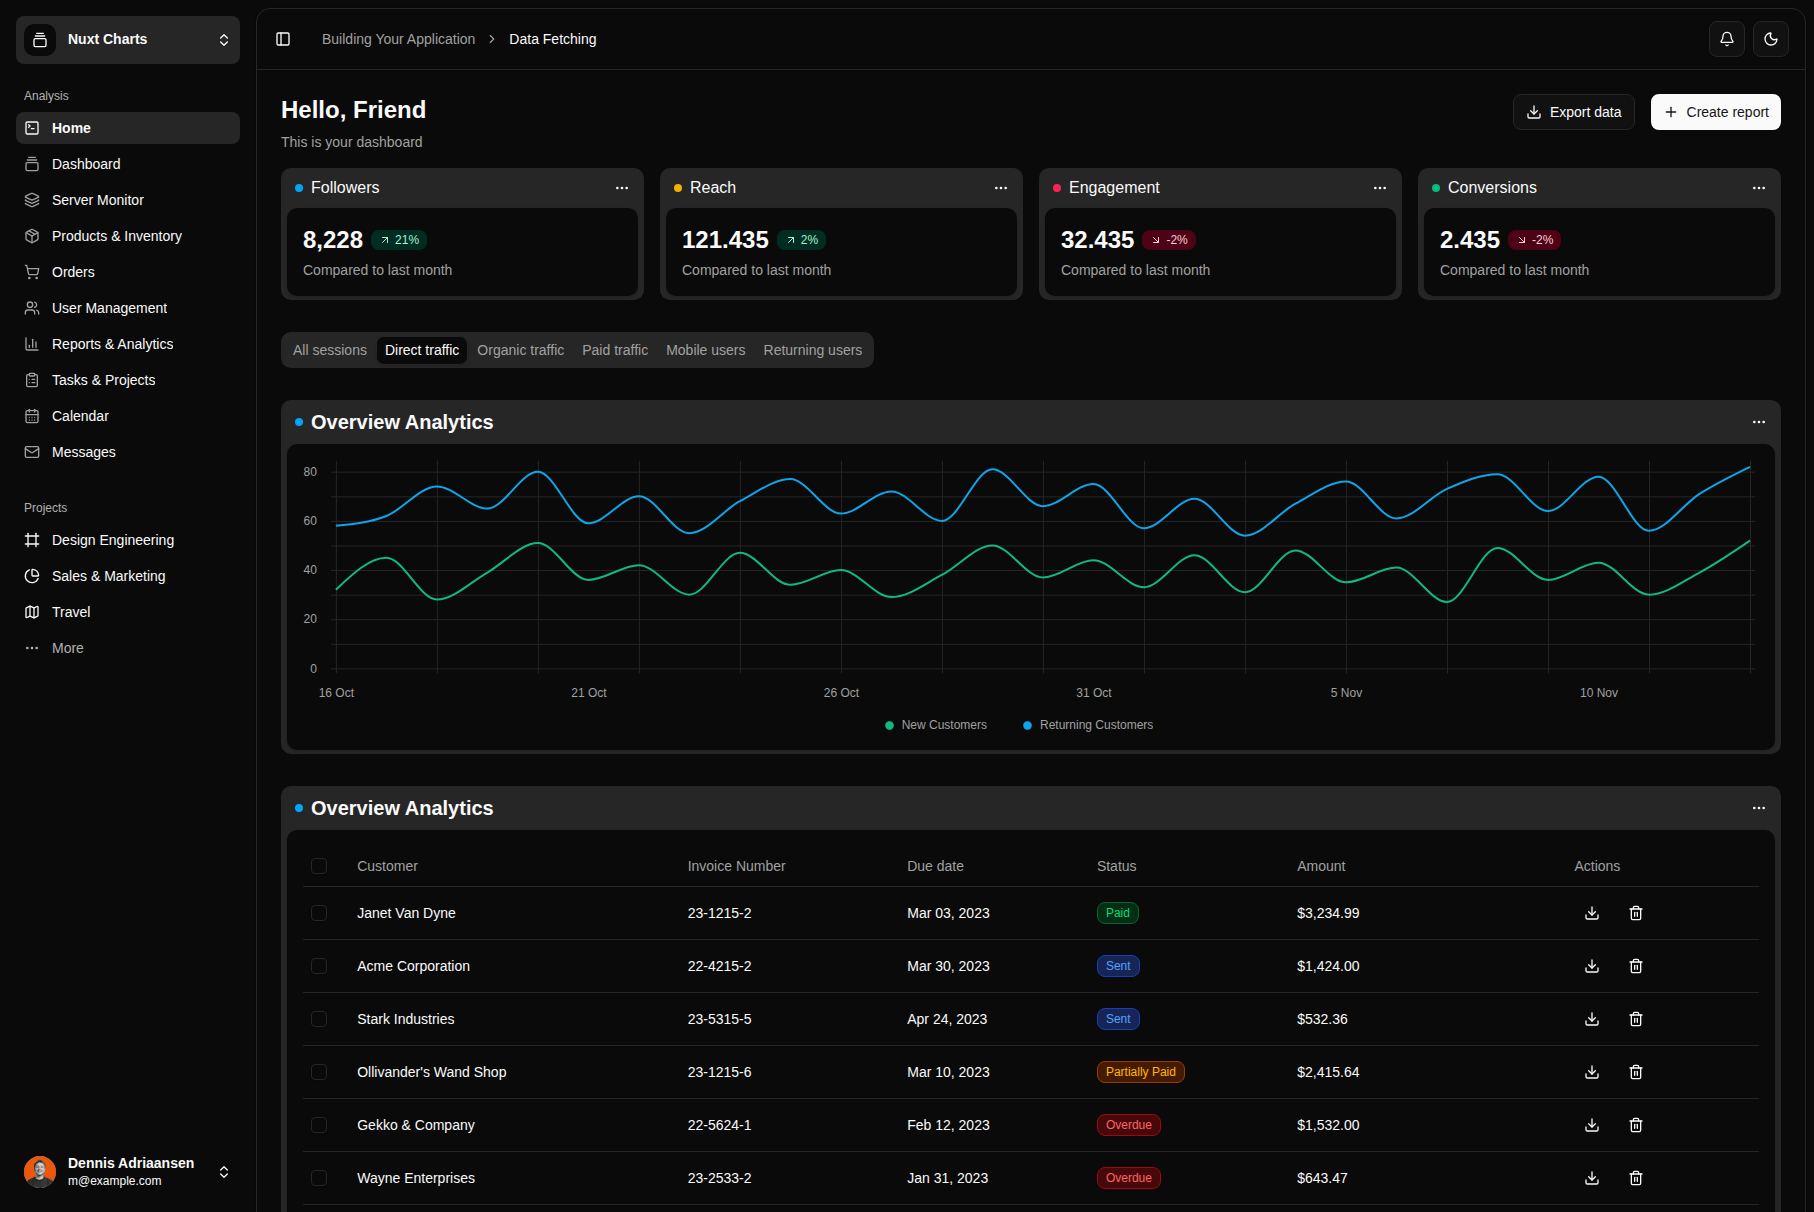
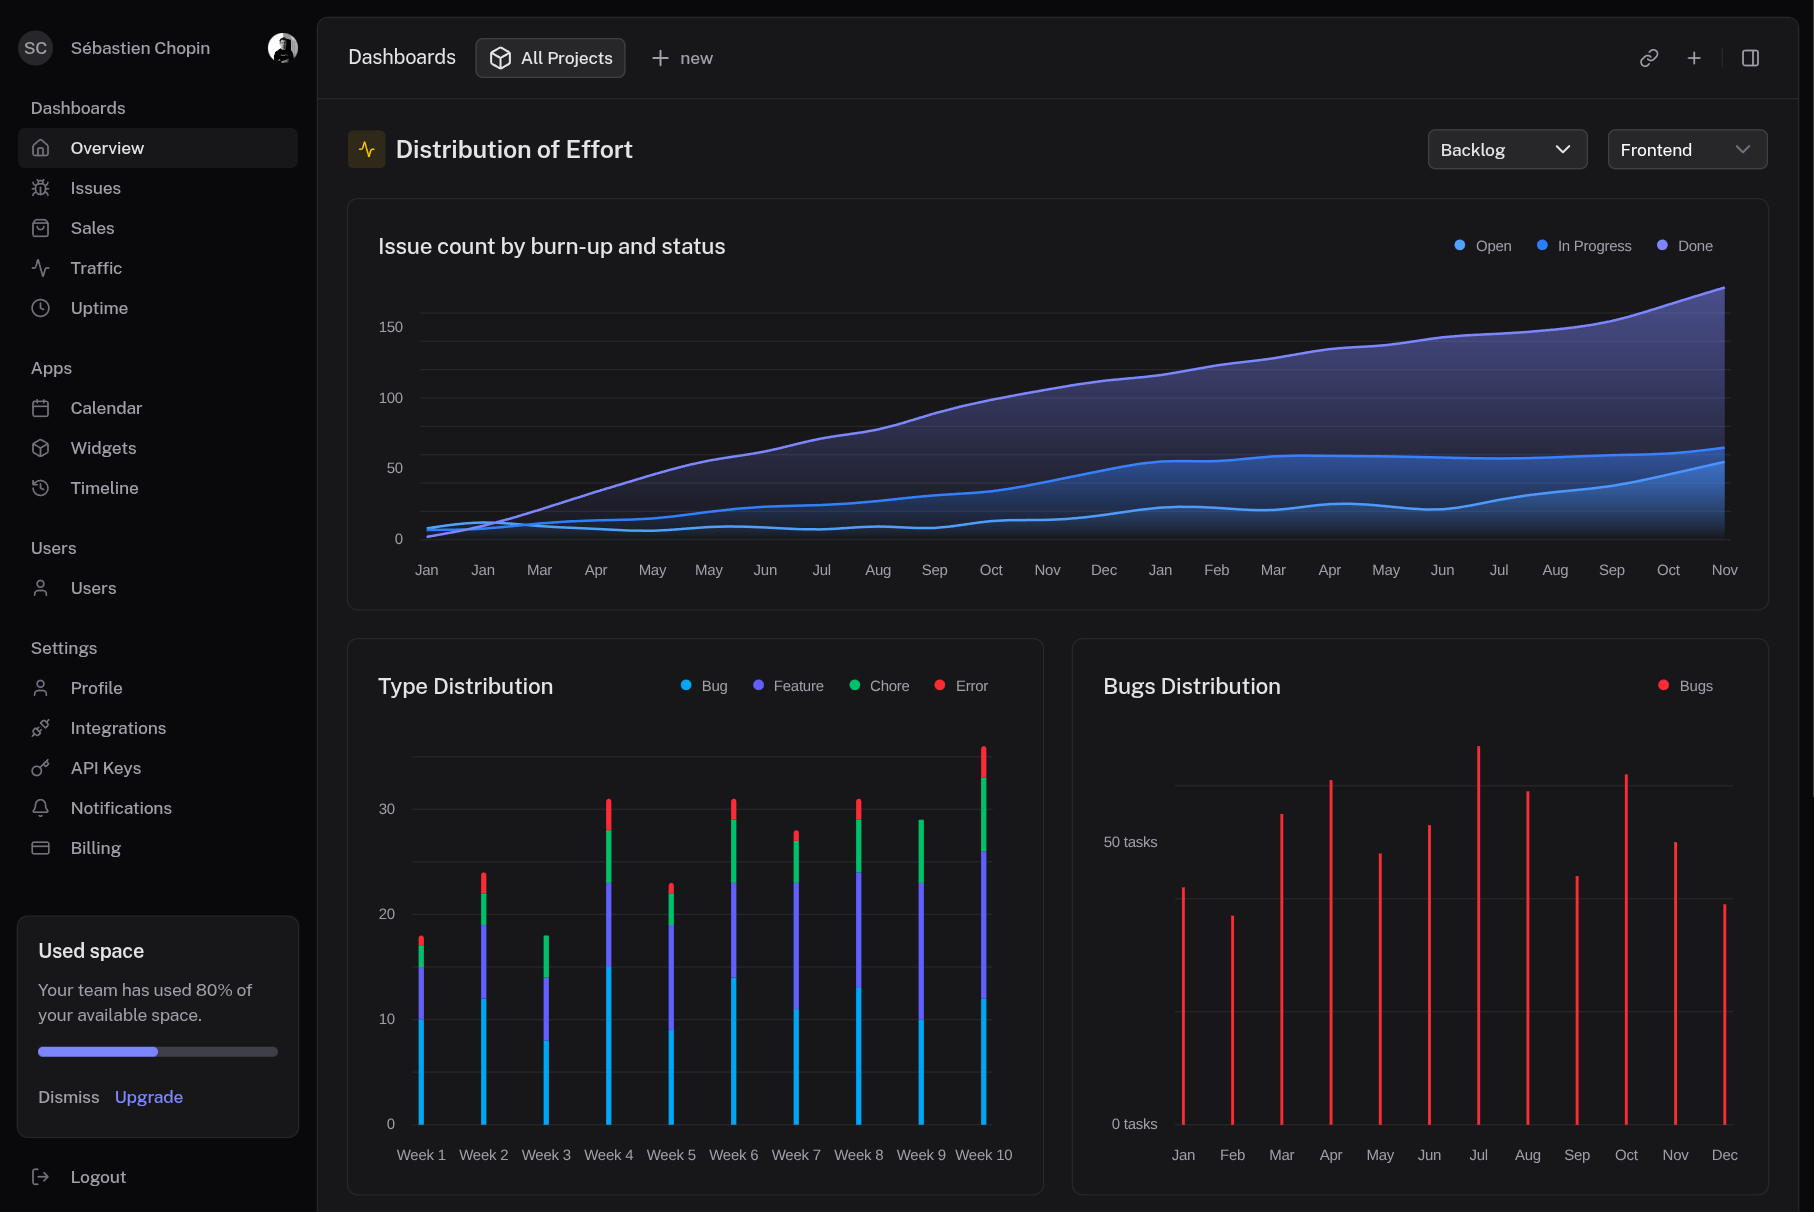
Dashboard
A comprehensive dashboard layout with charts and tables.
Ready to build something amazing?
Frequently Asked Questions
Everything you need to know about our templates